

KISS Regime Report — Week of 12 October 2026 — NEUTRAL
One verdict. The reasoning behind it. Your posture for the week ahead.
═══════════════════════════════════════════
WEEKLY REGIME VERDICT
═══════════════════════════════════════════
NEUTRAL
Posture: 30–50% capital — cleanest setups only
Held for a third week. SPY stayed above its 20 SMA and both indices still confirm Stage 2. Three of four conditions are still firing.
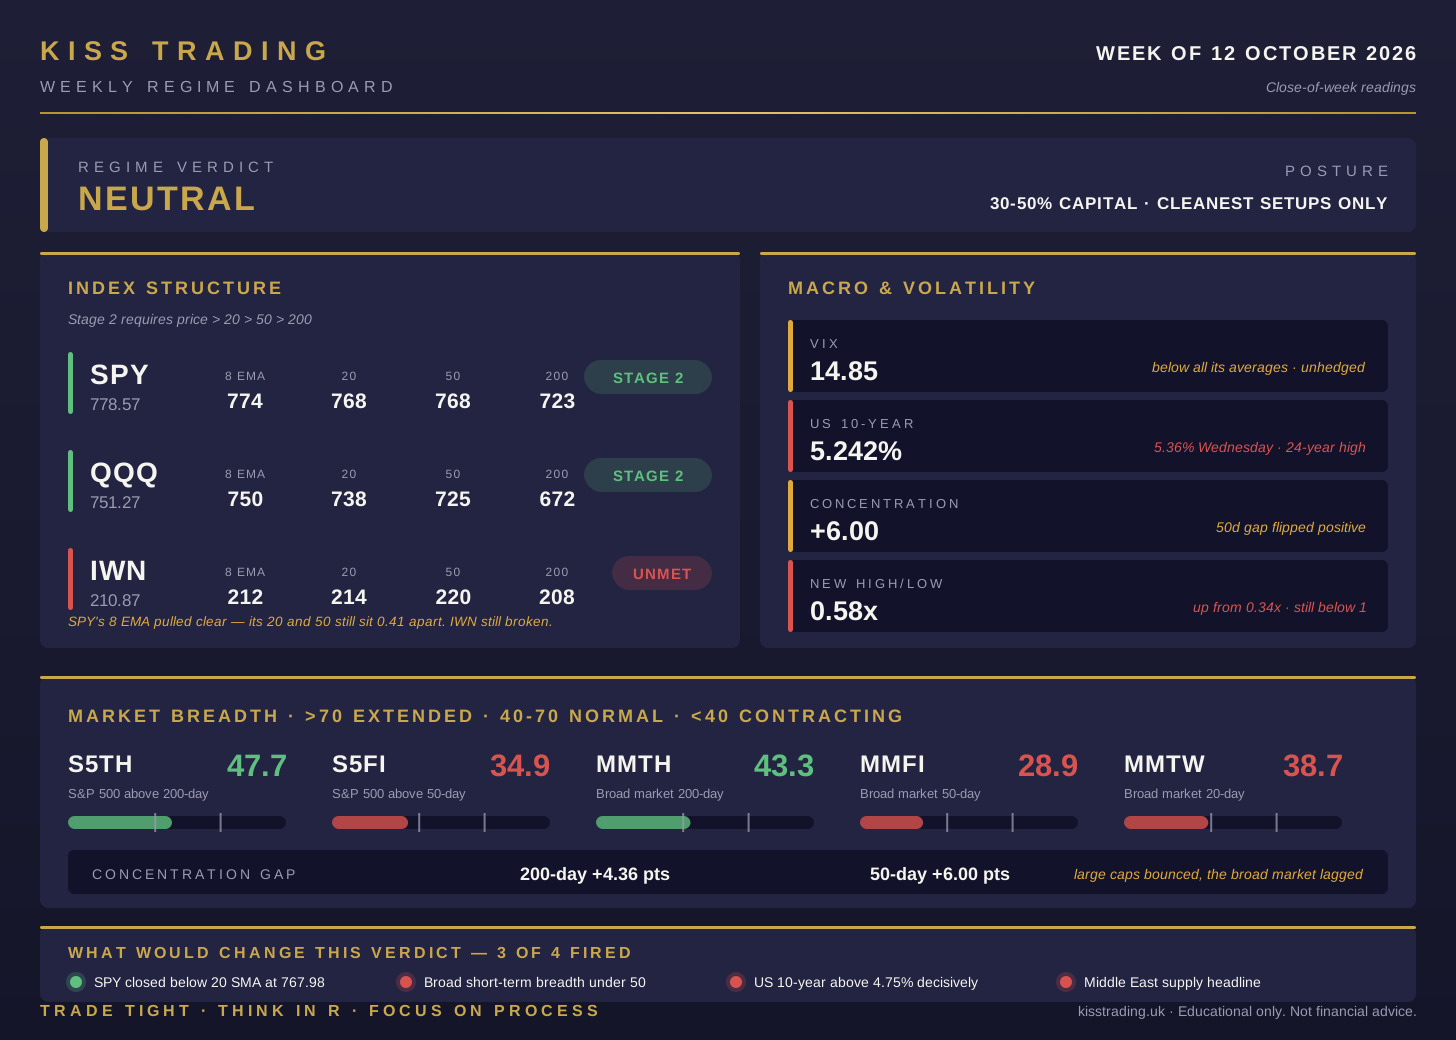
Last week breadth hit the floor. This week it bounced off it, hard. S&P 500 short-term breadth gained ten points and the index set a new record on Tuesday. But the bounce came from the large caps. The broad market barely moved, small caps fell, and the 10-year touched a 24-year high in the middle of it.
───────────────────────────────────────────
WHAT THE STRUCTURE SAYS
───────────────────────────────────────────
SPY closed at 778.57, up 1.2% on the week, above the 8 EMA at 773.83, the 20 SMA at 767.98, the 50 SMA at 767.57 and the 200 at 722.93. The 8 EMA has pulled almost six points clear of the 20, which is the first real spacing the stack has shown in a month. The 20 and 50 are still only 0.41 apart. That part of the squeeze hasn’t released.
QQQ closed at 751.27, just above its 8 EMA at 749.70, with the 20 at 737.54 and the 50 at 724.52. It gained only 0.2% on the week, so SPY outran it for the first time in several weeks. Structure is intact. Momentum paused.
IWN is still broken. At 210.87 it sits below the 8 EMA, the 20 SMA at 213.52 and the 50 SMA at 219.76, with the 20 under the 50. The Russell 2000 lost 0.9% in a week the S&P gained 1.2%. Small-cap value has now lagged for six straight weeks.
Key levels for the week:
→ SPY support: 773.83 (8 EMA), then 767.98 (20 SMA) · resistance: Tuesday’s record high
→ QQQ support: 749.70 (8 EMA), then 737.54 (20 SMA) · resistance: the early-October record high
───────────────────────────────────────────
WHAT BREADTH SAYS
───────────────────────────────────────────
S5FI closed at 34.93, up from 24.65. That’s ten points in a week and a close back above its own average for the first time since August. S5TH rose to 47.70, also back above its average. The washed-out reading from last week lasted exactly one report.
The broad market tells a different story. MMTW rose to 38.67, above its own average, but still eleven points short of 50. MMFI gained one point to 28.93. MMTH was flat at 43.34. Both are still below their averages.
The concentration gap shows why. A week ago S&P 500 breadth was weaker than broad-market breadth on both horizons. This week it flipped to +4.36 on the 200-day and +6.00 on the 50-day. Index members recovered their averages; the stocks outside the index mostly didn’t.
New highs versus new lows improved from 0.34x to 0.58x. Still below one. New lows still outnumber new highs almost two to one.
A bounce in the index’s own members is how a turn starts. It isn’t proof of one. The proof is the same as last week: MMTW above 50 and holding, or new highs outnumbering new lows. Neither happened.
───────────────────────────────────────────
WHAT MACRO SAYS
───────────────────────────────────────────
The 10-year touched 5.36% on Wednesday, its highest level since 2002, then closed the week at 5.242%, about three basis points lower than a week ago. The weekly number looks calm. The path wasn’t. Yields rose with oil midweek and eased with it on Friday.
The inflation signal kept building. ISM Services prices paid jumped to 74.0, the highest since July 2022, one week after the manufacturing prices index hit 77.9. Both surveys now say the same thing: costs are rising across goods and services, and fuel is the common thread.
VIX closed at 14.85, below all four of its own averages. Fourth week in a row with the same reading. Low volatility here means no one is paying for protection, not that there’s nothing to protect against.
───────────────────────────────────────────
WHAT ROTATION SAYS
───────────────────────────────────────────
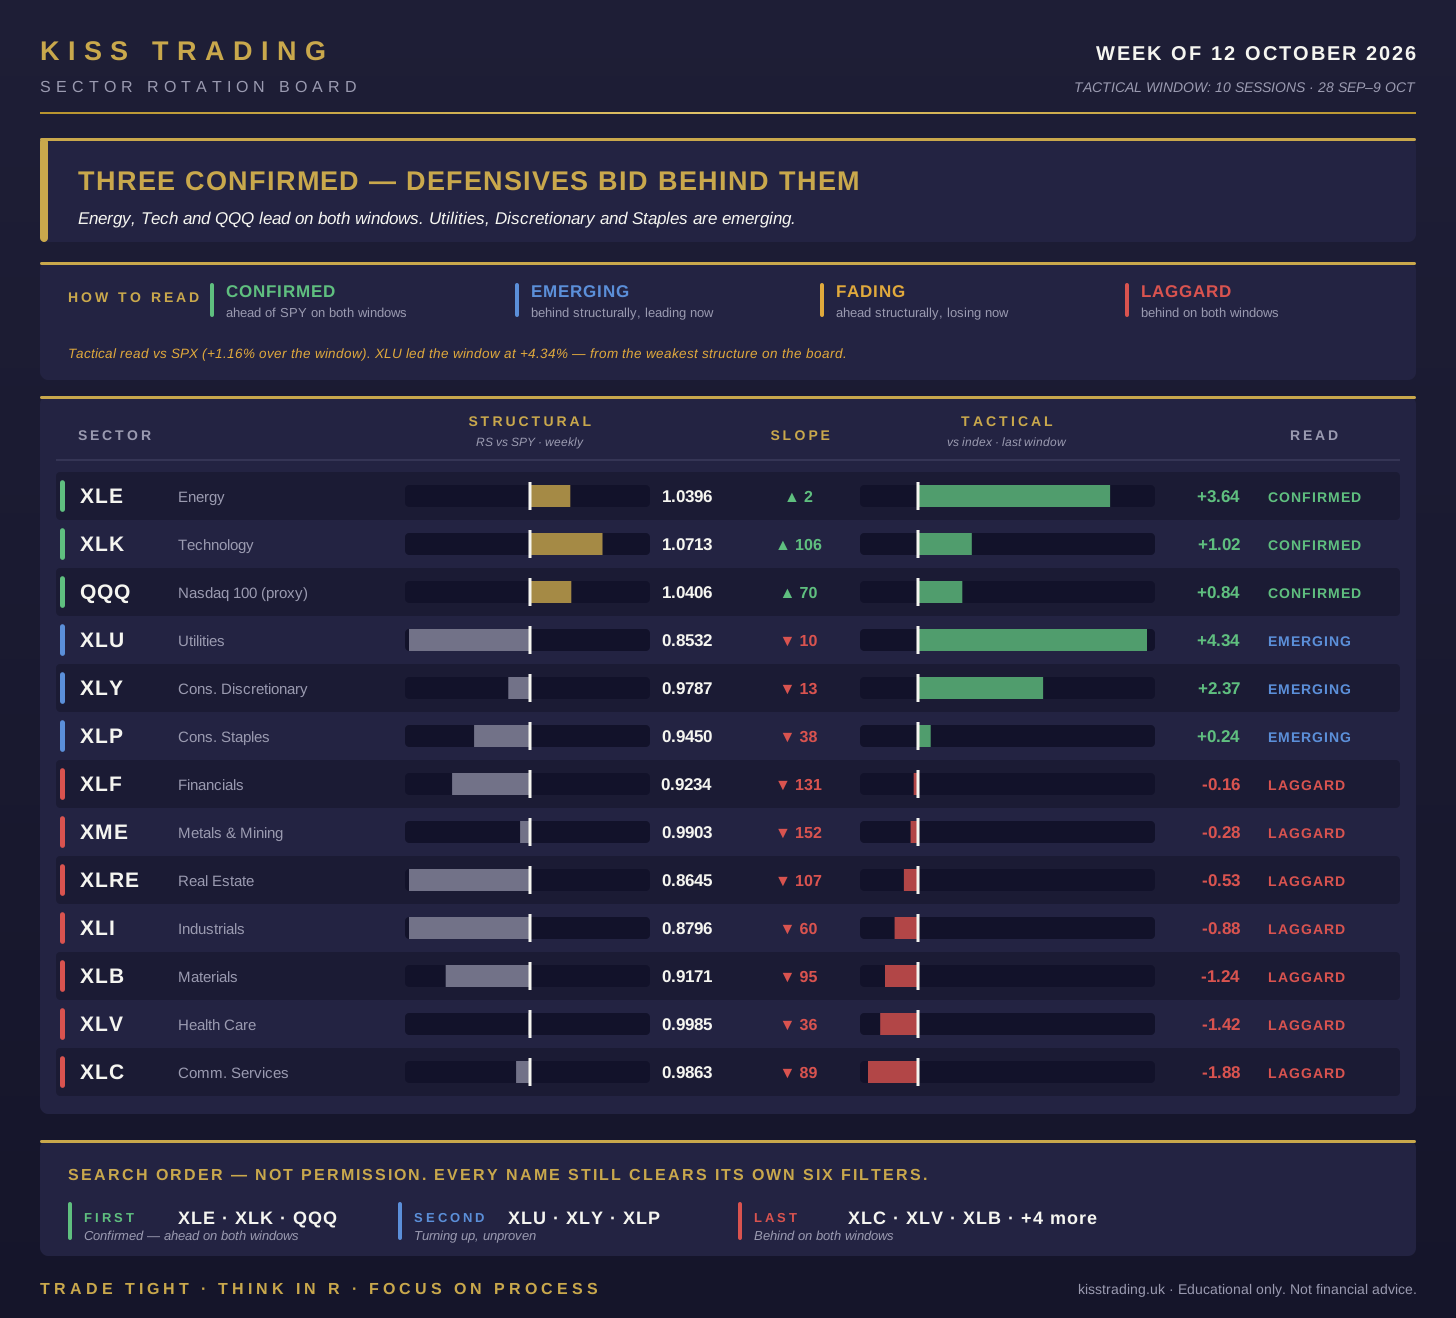
Three groups are confirmed on both windows. Energy leads tactically at +3.64% against the index, and its weekly slope turned positive (+2) after two weeks of steep deceleration. Last week Energy was confirmed on paper while fading in motion. This week it’s confirmed in both. The oil headlines explain why.
Technology stays confirmed with the strongest structure on the board, 1.0713, and the strongest acceleration, +106 a week. But its tactical lead shrank to +1.02%. QQQ is confirmed alongside it at +0.84%.
Three groups are emerging, and they’re an odd set. Utilities led the whole window at +4.34% — from the weakest structural position on the board, 0.8532. Discretionary gained +2.37% and Staples +0.24%. Two of those three are defensive. That’s money buying safety and yield-like income while the index makes records, not a broadening into cyclicals.
Seven sectors are behind on both windows. Health Care slipped further, now 0.9985 structurally and −1.42% tactically. Metals & Mining dropped below 1.000 for the first time in weeks, and its −152 slope is the worst on the board. Financials, Real Estate, Industrials, Materials and Comm. Services complete the list.
Search order is search order, not permission. In Energy, expect most names to fail the ceiling test: a sector up almost 5% in ten sessions on headline-driven oil rarely leaves a tight base. In Utilities, the sector context is new and unproven, so any setup there needs to clear all six filters on its own.
───────────────────────────────────────────
MACRO — WHAT LAST WEEK DELIVERED
───────────────────────────────────────────
→ ISM Services (September), Monday: 54.9 vs 55.0 expected, 27th straight month of expansion. Prices paid 74.0, highest since July 2022. Employment back above 50 at 50.1.
→ FOMC Minutes (September meeting), Wednesday: the hike to 3.75%–4.00% was unanimous. Most participants judged another increase likely appropriate by year-end.
→ Rate odds: October hike odds near 17%; December hike odds around 84%.
→ Oil: tanker attacks around the Strait of Hormuz reached a weekly high since the war began, and a Gulf storm shut in some US output. Brent topped $104 on Thursday and stayed above $100 into the weekend.
→ Treasuries: 10-year intraday high of 5.36% on Wednesday, highest since 2002. Closed Friday at 5.242%.
→ Indices: S&P 500 record close Tuesday; +1.2% on the week. Nasdaq +0.6%. Russell 2000 −0.9%.
───────────────────────────────────────────
MACRO FLAGS — WEEK AHEAD
───────────────────────────────────────────
→ Monday 12 October: Columbus Day. Stocks open, bond market closed — thin Treasury liquidity, oil headlines can move more than usual.
→ Wednesday 14 October, 8:30 ET: September CPI. Headline expected +0.6% monthly, 3.6% annual. Core expected +0.2% monthly, 2.5% annual.
→ Thursday 15 October, 8:30 ET: PPI, retail sales, jobless claims and Philly Fed, all at once.
→ Thursday 15 October, late evening ET: Fed Chair Warsh speaks.
→ Tuesday–Wednesday 27–28 October: FOMC decision, less than a week before the 3 November midterms.
Calendar note: CPI on Wednesday makes it a no-new-order session. Any armed buy stop is cancelled by Tuesday’s close, and Tuesday evening is not an arming evening. The clean arming evenings are Sunday and Monday (for Monday and Tuesday sessions), then Wednesday and Thursday evening (for Thursday and Friday). Third-quarter earnings season is under way — check every candidate’s report date against the hold rule before arming.
───────────────────────────────────────────
VERDICT RATIONALE
───────────────────────────────────────────
NEUTRAL holds, and it holds for the same reason it was granted: SPY is above its 20 SMA and both indices confirm Stage 2. Nothing in that test changed this week, except that the margin got wider.
What improved: S&P 500 breadth came off washed-out levels in one week, the index set a record, and SPY’s short-term average finally separated from the pack.
What didn’t: the broad market barely participated, small caps fell, new lows still outnumber new highs, and the 10-year made a 24-year high in the middle of the rally. The sectors that gained most were Energy and Utilities. That isn’t the leadership of a market about to broaden.
None of those readings is one of the four conditions, so none of them moves the verdict. Breadth is recorded, never a gate. Rotation is context, never a filter.
What upgrades this to BULLISH CAUTION: MMTW above 50 and holding — it’s at 38.67, still eleven points short — or new highs outnumbering new lows, now 0.58x.
What takes it back to BEARISH: a SPY close below its 20 SMA at 767.98, 1.36% below Friday’s close. Twice the cushion of a week ago.
The four conditions, as they stand:
→ SPY closed below its 20 SMA — CLEARED, 778.57 vs 767.98
→ Broad short-term breadth under 50 — FIRED, MMTW at 38.67
→ US 10-year above 4.75% decisively — FIRED, 5.242%, after a 24-year high at 5.36% midweek
→ A Middle East supply headline moving oil sharply higher — FIRED, Brent back above $104 on renewed Hormuz tanker attacks
═══════════════════════════════════════════
WATCHLIST + TRADE PLAN (PAID)
═══════════════════════════════════════════
Paid subscribers receive immediately below:
→ The Weekly Watchlist — every name scanned, every name
rejected, and the exact number that killed each one
→ Entry triggers, Retest Shield levels, and R-targets
→ The Trade Plan of the Week — fully sized, ready to execute
Everything is decided before Monday opens. You execute.
The system does the thinking.
Upgrade at kisstrading.uk to access the full system.
───────────────────────────────────────────
Trade Tight · Think in R · Focus on Process
— Radu
KISS Trading
───────────────────────────────────────────
⚠️ Educational only. Not financial advice. Always DYOR.